An Executable Knowledge Graphs as a Public Wiki
WikiSim contains executable knowledge graphs. This application demonstrates the capability of showing the difference between a knowledge graph and its alternative to discover the main causes of differences between the two perspectives.
WikiSim contains executable knowledge graphs. This application demonstrates the capability of showing the difference between a knowledge graph and its alternative to discover the main causes of differences between the two perspectives.
With WikiSim I am building a public computable knowledge graph¹ to help support us understand which actions and policies (government or otherwise) are possible from those which are just wishful thinking.
This will mean that when someone makes a claim such as
"To achieve X it will cost £Y"
or
"We can only do X, we can't do Z to tackle problem Y."
then those values of XYZ can be - should be - derived from a whole bunch of other values e.g. it might look something like:
And that's a knowledge graph. And if you could run that calculation of
quantity * cost = £Y then it would be a computable knowledge graph.
Disagreement
That means that if someone disagrees with that claim, then instead of being vague, they can now be specific about what they disagree with. For example if there was a knowledge graph like this:
... it is clearly wrong in a couple of places:
- £Y should be calculated by multiplying
quantityandcost, not adding them - the "Cost of A in €" node is not wrong but it's being used in the wrong place and instead the node² that should be referenced is "Cost of A in £" or include the use of an intermediate node like "Convert € to £".
Disagreement Resolution
With this more detailed view of the knowledge and disagreements it would then be trivial to either
- fix the problems either directly in the public wiki or
- by proposing an alternative graph
WikiSim could in future also make it easy to compare the two graphs to understand where exactly the disagreement is.
Validating from Source
When these knowledge graphs are used to power a visualisaton, or simulation / serious game, then individual numbers and properties that emerge can be directly traced back to the individual components of the knowledge graph.
This means it is much easier to show how the claim is derived from data and assumptions and this should make it easier for everyone to understand and verify the claim, i.e. to easily see the data it is derived from, its context, the calculations performed on that data, and understand the different assumptions behind those data and calculations.
A Real World Example
In 2009 David MacKay published his book "Sustainable Energy - without the hot air" and whilst loading it into WikiSim to power a new national energy game I realised it had a minor mistake in it. This shows up as a different between the numbers in the energy budget "stacks" from the book and those that are now in the Wiki:³
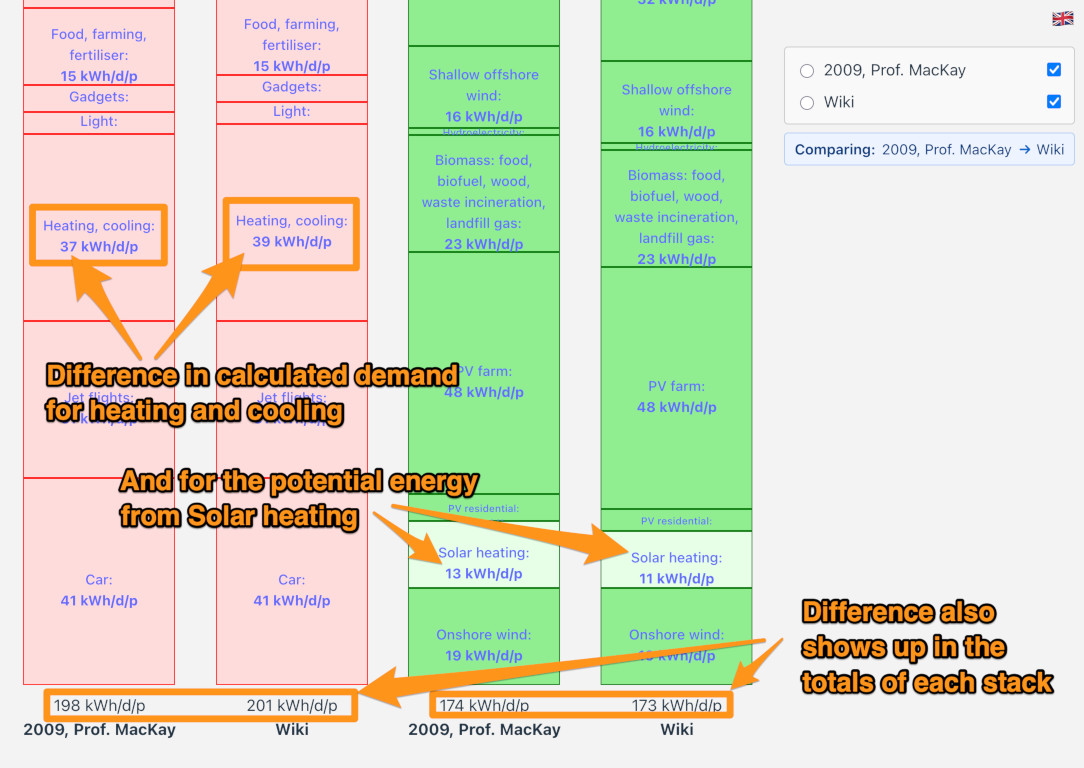
You'll see the difference also shows up in the totals presented at the bottom of each stack.
This is already a great improvement over existing visualisations which would not easily show the difference between two different perspectives on the world. But we can do better than this.
If we want to know where exactly the difference is we can view the underlying knowledge graph and drill down to the exact data component / nodes which are different:⁴
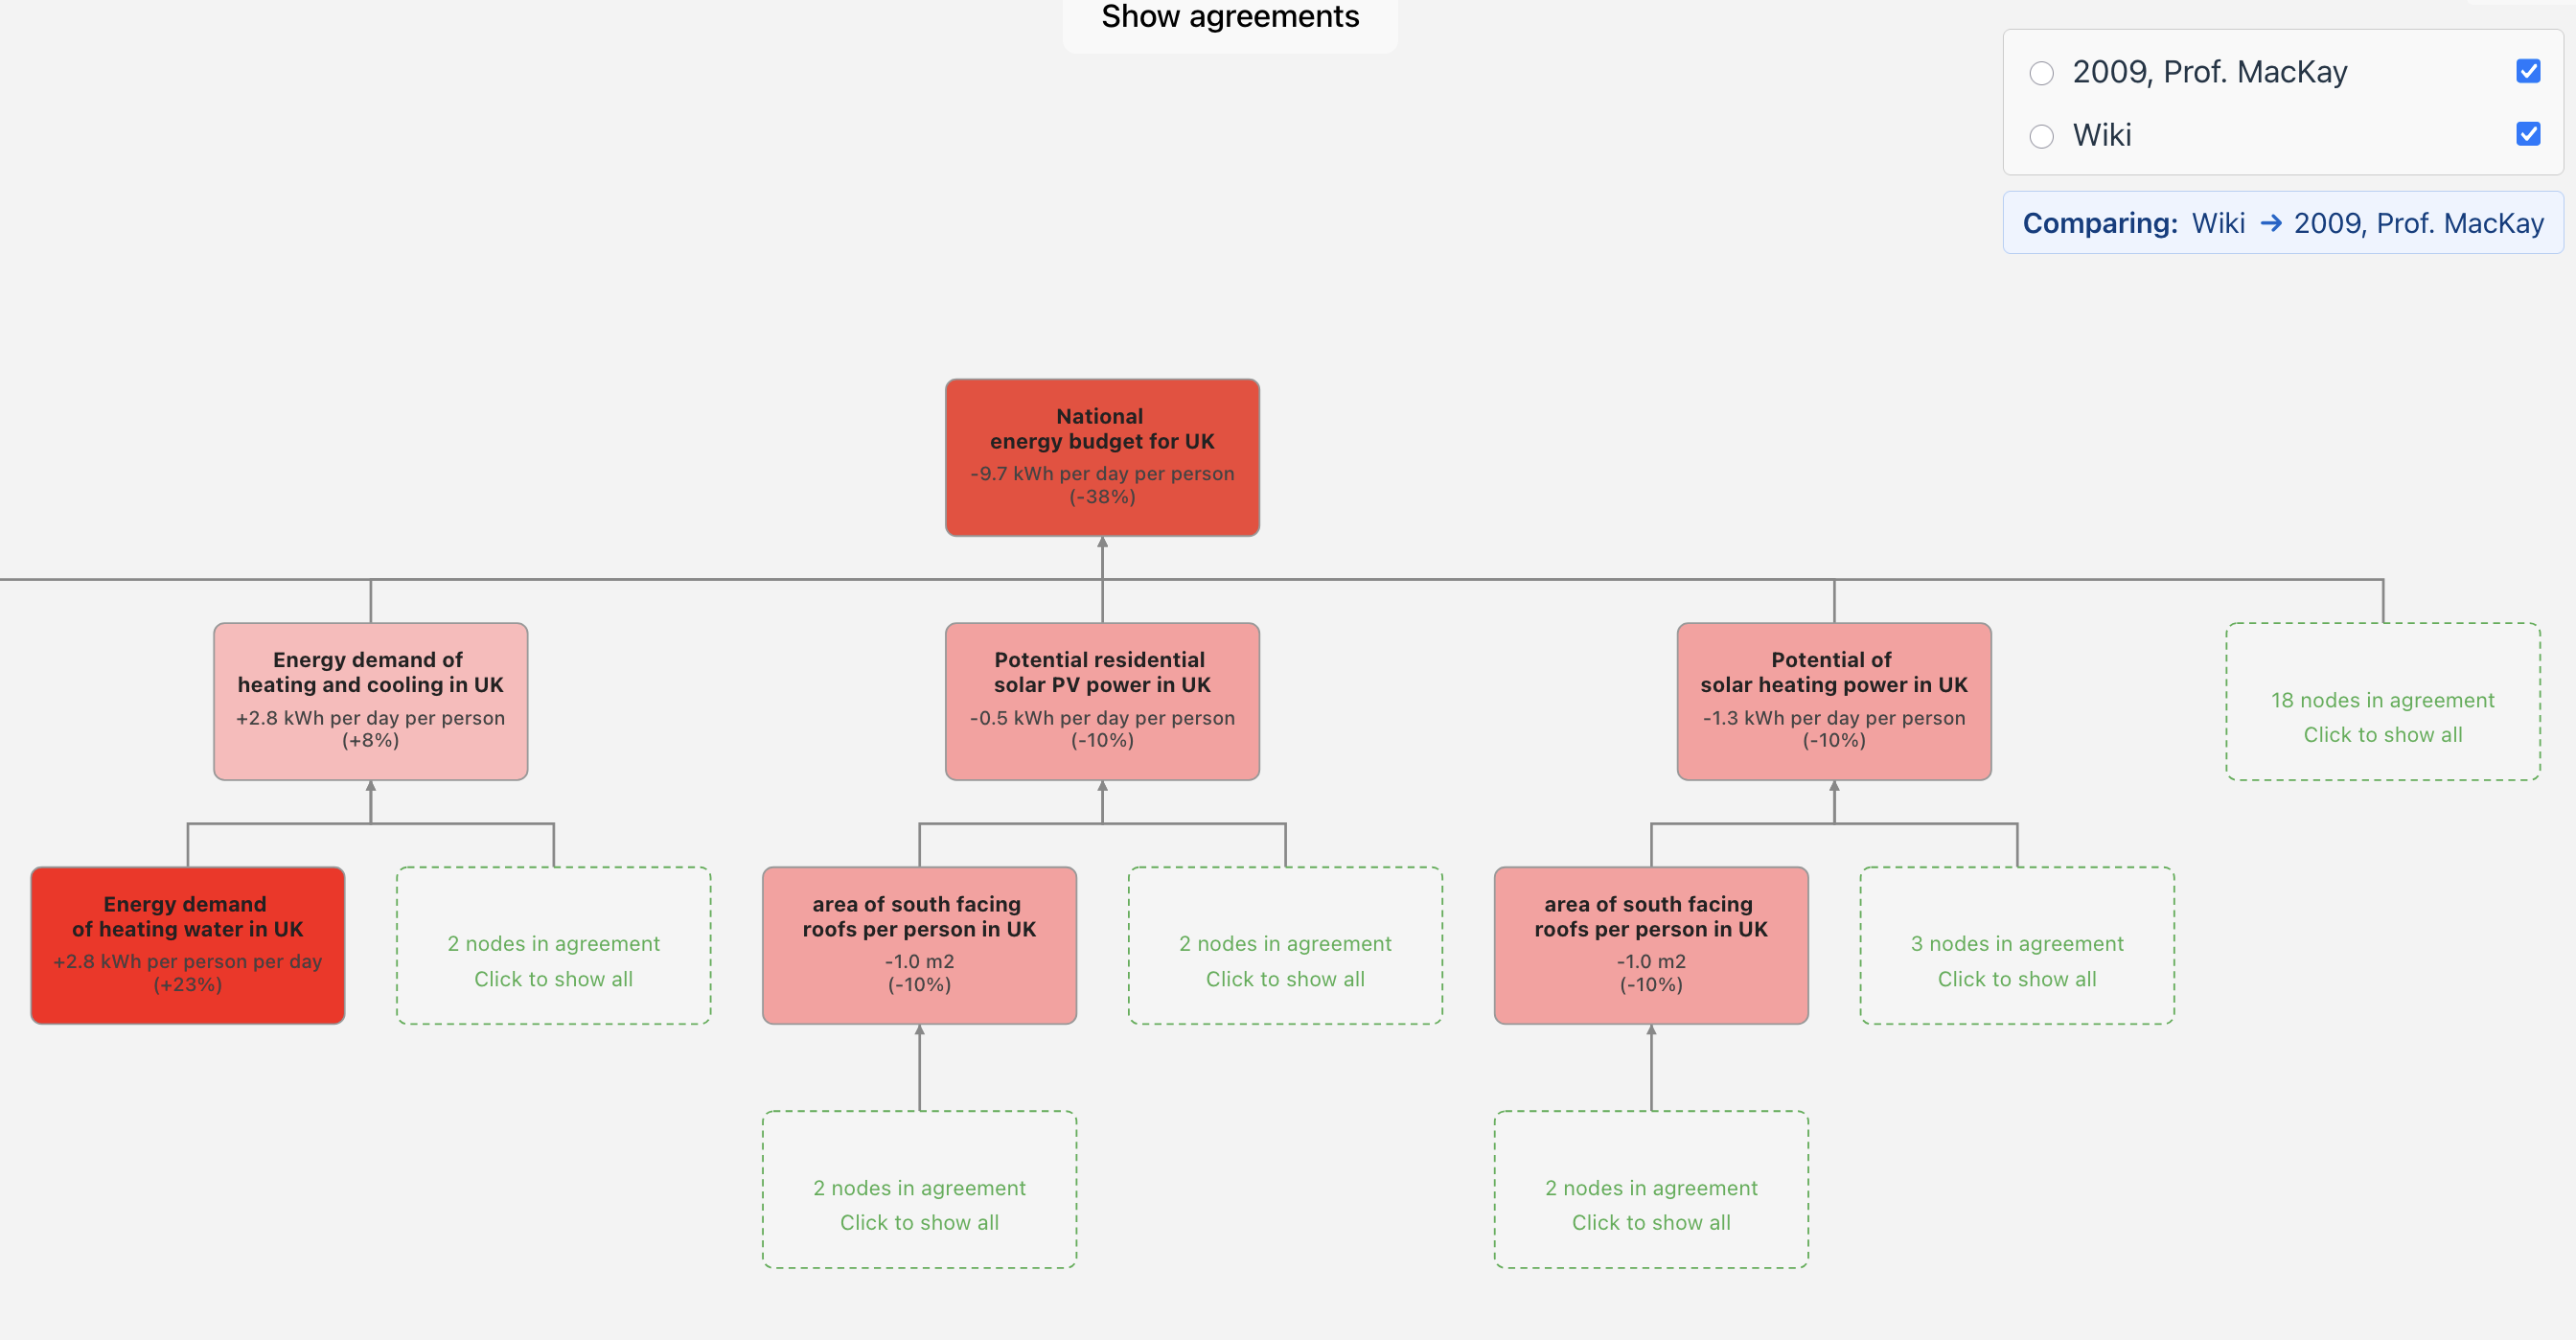
A knowledge graph showing the nodes that differ between it and an alternative knowledge graph (perspective)
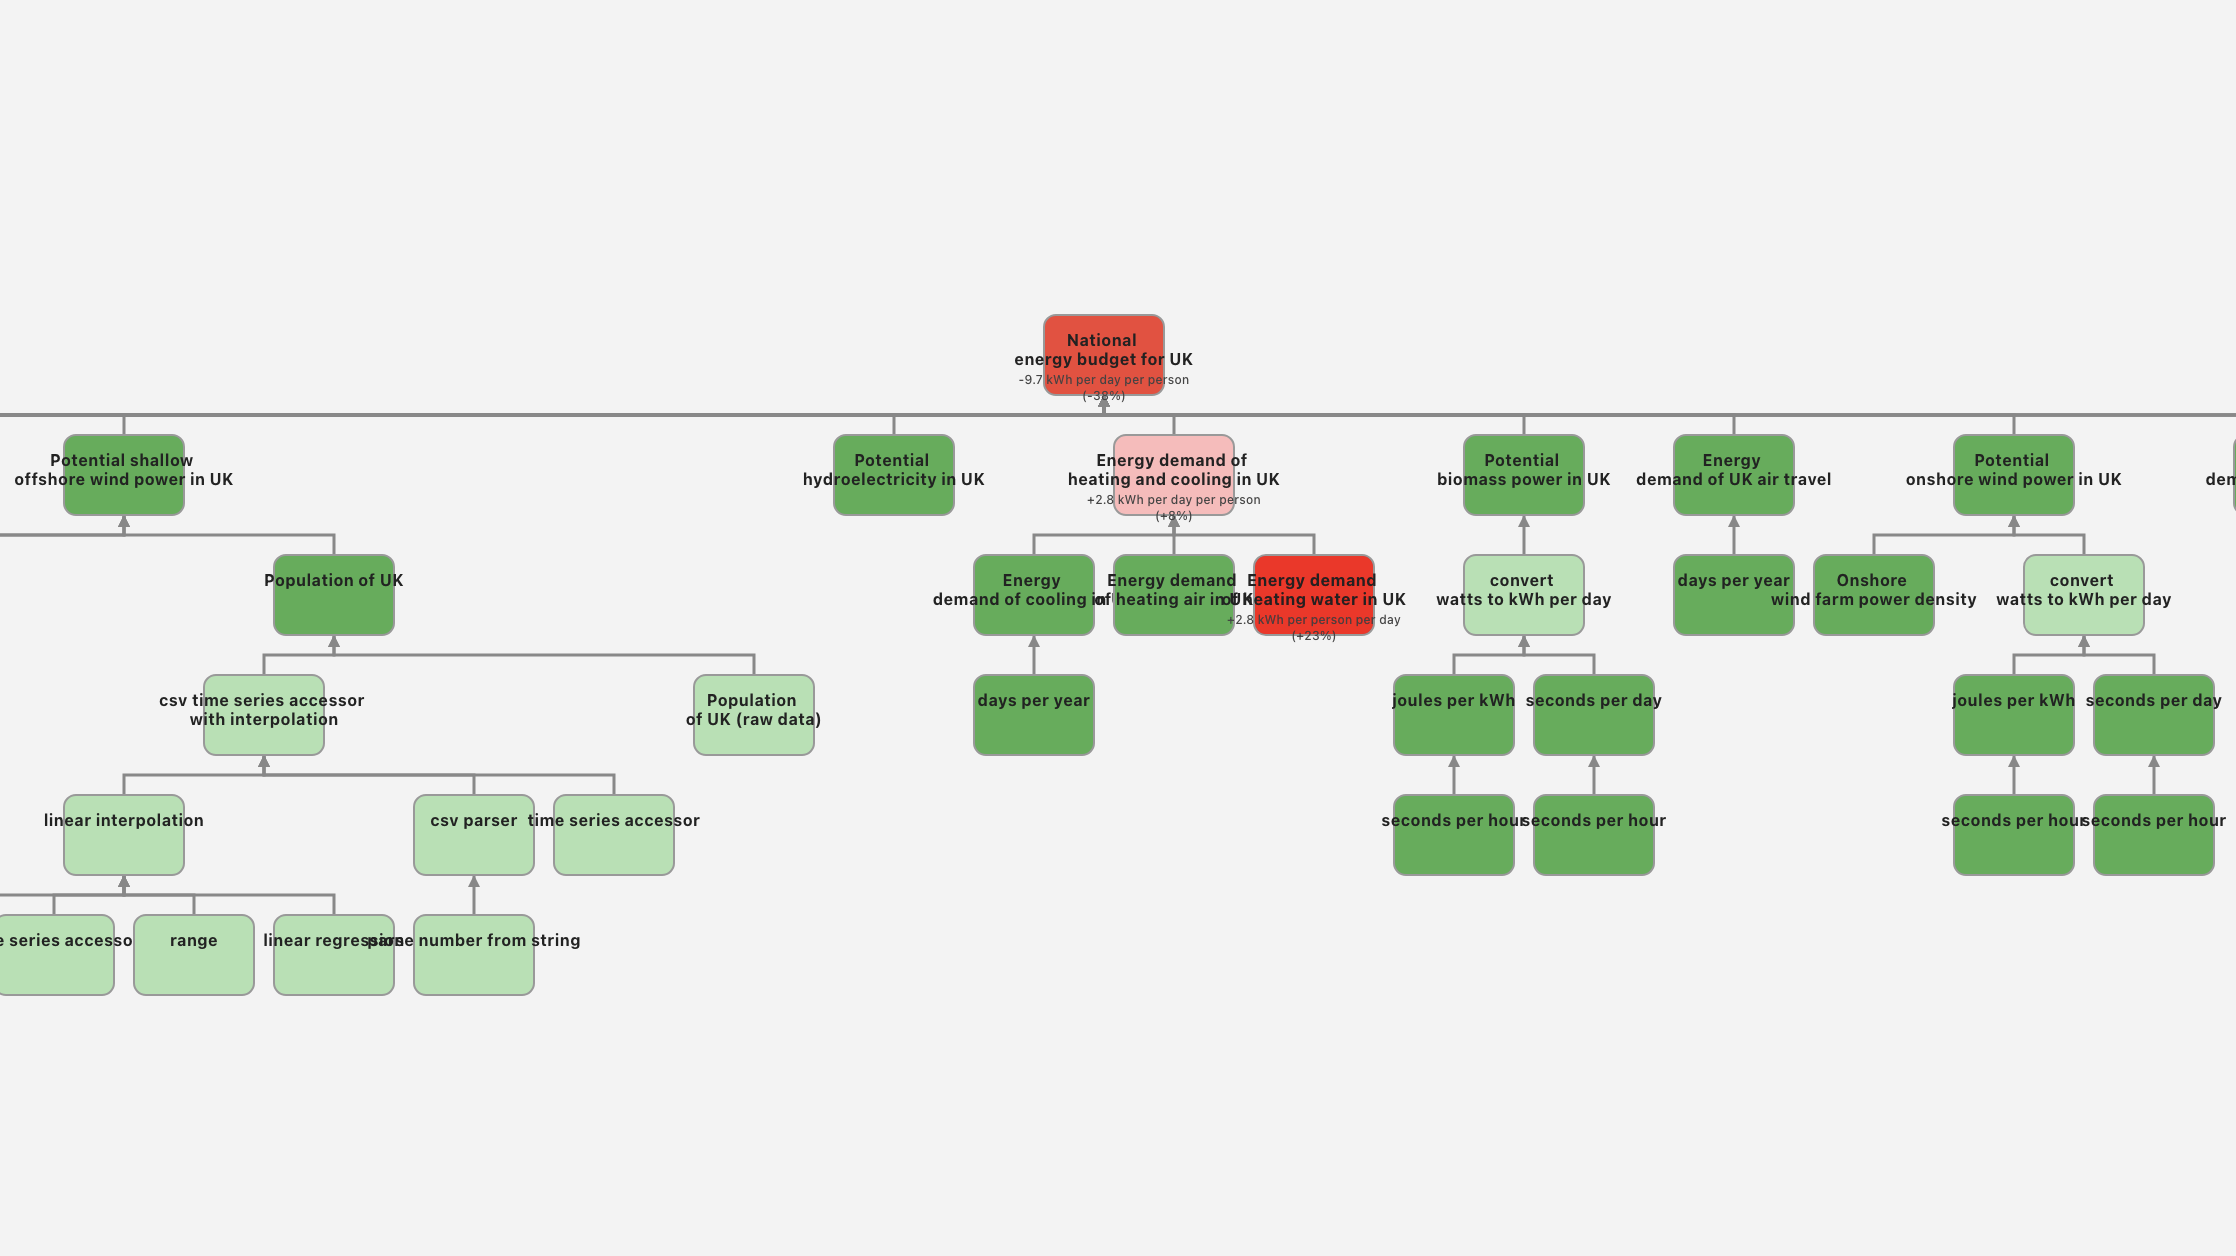
You can play with that example here:
Click on this (special) link wikisim.org/wiki/1272v28 and then click "play".
I'm interested to see if this view might one day be available and useful to help people more quickly pin point where exactly disagreements lie and to resolve them efficiently either through:
- agreement i.e. direct convergence
- reframing disagreements as a question / experiment to run to find out the answer.
- agreeing to disagree i.e. accepting that there are multiple options and that any plan needs to be flexible enough to accommodate them all.
Notes
¹ Also referred to as an "executable knowledge graph"
² In WikiSim a "node" would be a single page like "Potential biomass power in UK". I have sometimes referred to each page as a "node" or as a "data component".
³ These energy balance sheet stacks are available here for now but...
⁴ ...this graph view below is not published yet, however the code is here.