How much of the UK's built area could be covered in solar panels?
For the National Energy Explorer simulation I'm building I need to know how much area of an urban or suburban grid cell would have south facing roofs. And how much that would produce in terms of electrical power from solar PV.
I have taken two approaches.
1. Back of the Envelope
The first approach is a basic back of the envelope calculaton using the existing figures.
The UK's Centre for Ecology & Hydrology (CEH) has a data set on Land Coverage. This breaks the UK's area down into 10 x 10 m pixels which are classified into different categories. An online map can be seen here.
If we sum the urban and suburban areas of the UK and then use that to divide the total "area of south facing roofs in Britain" from Prof. David MacKay's 2009 book Sustainable Energy Without The Hot Air, then we can calculate the "Ratio of south facing roofs in UK to area of built up land":
     area_of_built = (

          UK suburban land coverage (2024) total area km2

          + UK urban land coverage (2024) total area km2

     )

     ratio_of_south_facing_roof_to_built = (

         (area of south facing roofs in Britain / 1e6)

         / area_of_built

     )
Which gives us a ratio of 0.029.
We then multiply that ratio by the "Potential electrical power from solar PV on south facing roofs in UK" - which currently has a value of 22 W m-2 - to arrive at the "Potential solar PV power for built areas in UK".
     potential_solar_pv_power_for_built_areas = (

         Potential electrical power from solar PV on south facing roofs in UK

         * Ratio of south facing roofs in UK to area of built up land

     )
We arrive at a value of 0.63 W m-2.
2. Manually Labeling Satellite Imagery
Alternatively, to calculate the ratio of urban and suburban areas that are south facing roofs I took a satelite image of part of London's surburbs. These are categorised by the CEH as "urban" and "suburban" (see second image below). And I manually labelled the parts of the roofs suitable for solar panels (see third image below).

Aerial image of part of East London
 Land coverage data showing black darker pixels for urban and light for suburban")

In GIMP the roof areas show up as ~500,000 pixels and the total pixels of the image as ~3,840,000 pixels.
This gives a final ratio of ~0.131.
That's a 4.5 fold difference with 0.029 from the back of the envelope calculation.
Possible Reasons for the Difference
- The area of built (urban and suburban) land in the UK does include a lot of areas which are lower density with fewer roofs. Ironically the CEH land coverage data also (currently) labels solar panel farms as "suburban" as I discovered when I used Robin Wilson's "Aerial Image Search Demo" to find solar farms:
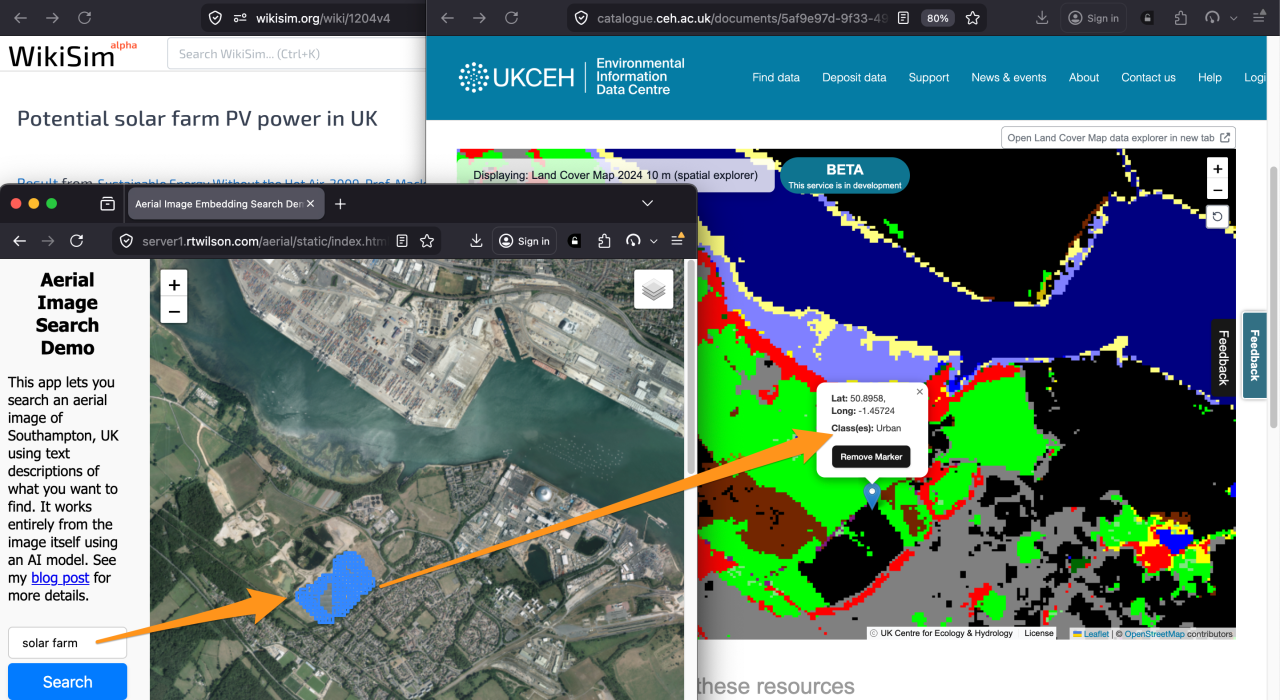
This image is also a good example showing the large areas of industrial land, and docklands which are labelled as "urban" but clearly have no suitable roofs for solar panels.
- ... ? I don't know.
Conclusion
As we can't relabel the CEH land coverage data to distinguish between areas of built land which potentially have a high density of south facing roofs and built land which does not or is actually a solar farm then sticking with the initial back of the envelope calculation based off Prof. David MacKay's work seems more likely to be correct.