Conversation Upgrade #1 - GBP to EUR exchange rate around Brexit
TLDR: validating claims in conversations is hard without good tools & data. Data is sometimes hard to find, or hard to make sense of as our online tools / mediums do not allow for quick calculations, visualisations and validations to be performed.
TLDR: validating claims in conversations is hard without good tools & data. Data is sometimes hard to find, or hard to make sense of as our online tools / mediums do not allow for quick calculations, visualisations and validations to be performed.
The original conversation
The original conversation happened in the comments section of an opinion article about the UK Labour government's recent budget changes.
Whilst I thought upgrades could be found in various comment threads, one thread in particular stood out. Below is the thread with some of the claims highlighted, along with examples of good conversation. Some less productive parts of the exchange are hidden like: this.
Okay so there are a lot of claims in that conversation. I chose to highlight 7 of them which refer to easily quantifiable things, so they should be easy to assess as correct or incorrect but it turns out some are not so easy.
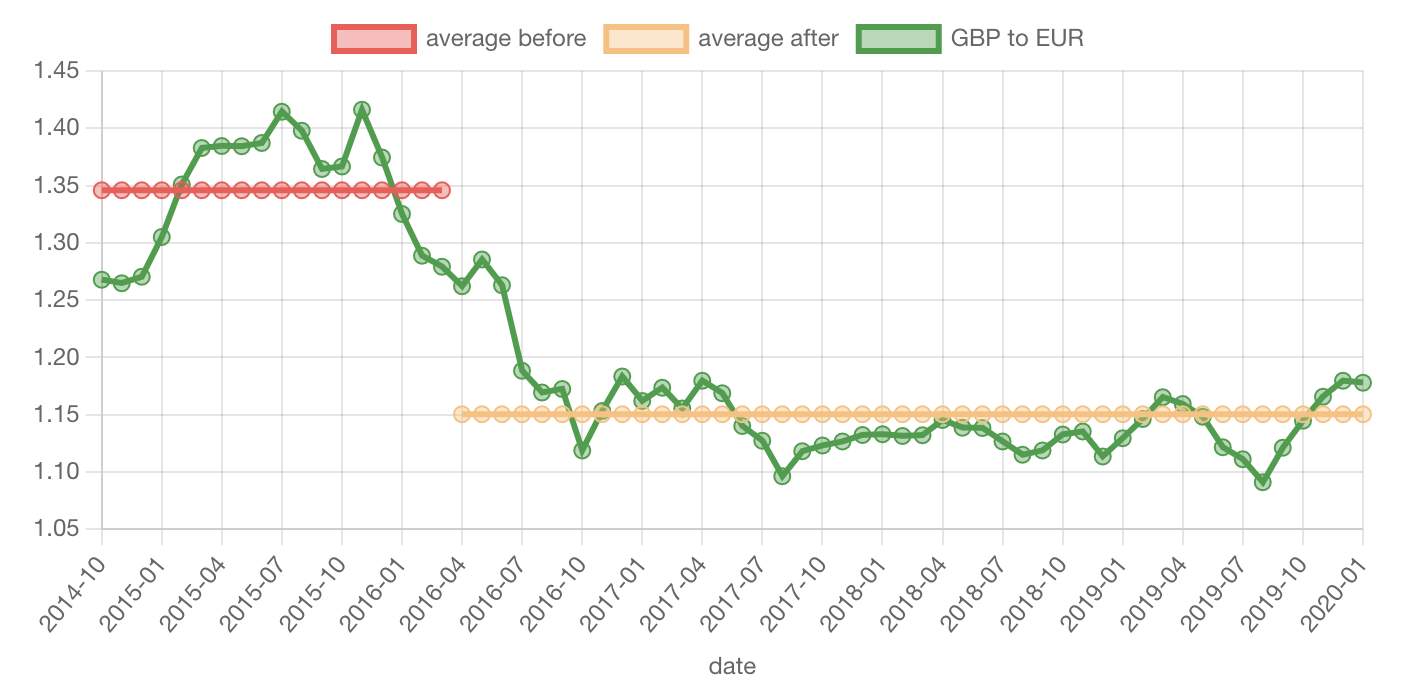
Most of the claims revolved around GBP to EUR exchange rates, so let's look at that data first.
Claims - GBP to EUR exchange rates
I've made my own assessment of the claims and marked them as true (validated the claim), false (invalidated the claim), or not enough info (could neither validate or invalidate).
FX rate for £stg is down by at least 20% -- £1 = €1.43 - 16/11/2016 -- £1 = €1.14 - today -- December 30, 2008 when £1 = €1.02 -- average exchange rate from 1 October 2008 to the date of the Brexit referendum was £1 = €1.125 -- obvious trend that coincides with the Brexit vote --
And here's some of the data to answer these claims:
 Source: How did the GBP to EUR exchange rate change before and after the 23 June 2016 UK Brexit Referendum? -- wikisim.org/wiki/1153v9 (TODO: insert interactive! WikiSim graph here)
The easy ones
Let's deal with the 3 single data points which are all validated as being correct:
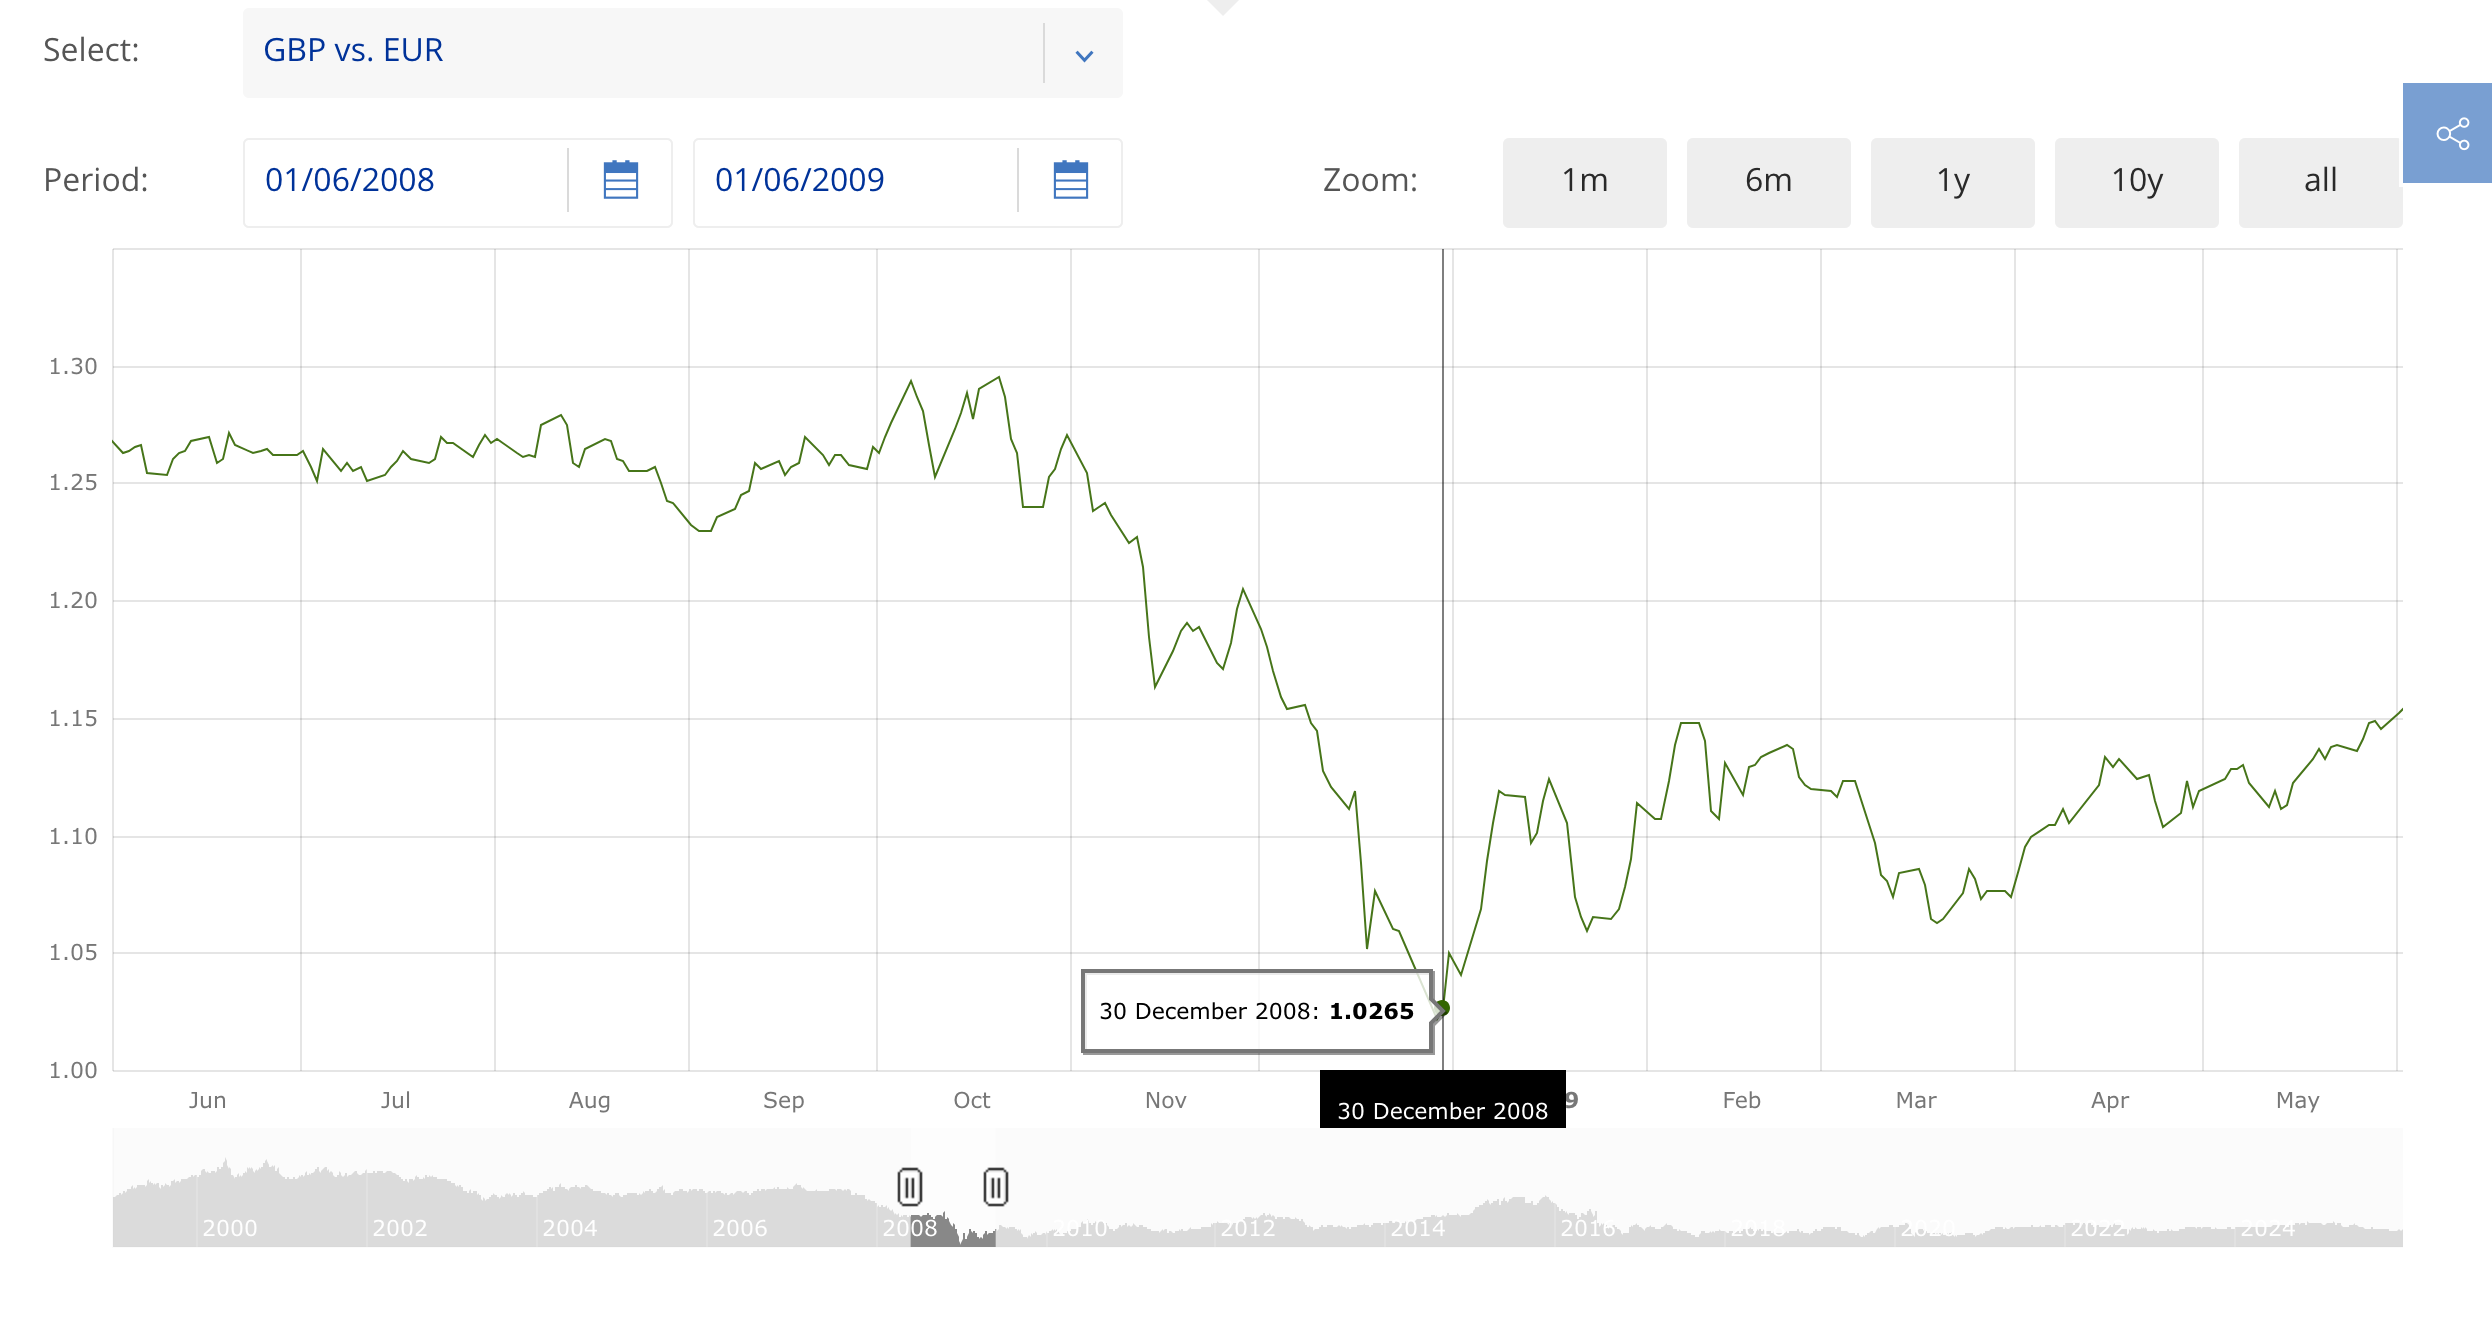
£1 = €1.43 - 16/11/2016 -- £1 = €1.14 - today -- December 30, 2008 when £1 = €1.02 --
Assuming you have the graph of GBP to EUR in front of you and you don't make a mistake reading it, you can construct a valid claim. As they have done.
(Note: initially I could not easily find the daily values back in 2008 (the graph is for monthly averages) but the European Central Bank do have historical exchange rate data and whilst technically F Parten should have said 1.03 or have 29th Dec 2008, their claim is close enough.)
The obvious one
Let's examine PFJ's final claim about the trend coinciding with the Brexit vote and, in the original sentence which infers causation by Brexit:
Now [explain the] obvious trend that coincides with the Brexit vote --
There is a clear downward trend in GBP to EUR exchange rate from immediately preceding and soon after the Brexit referendum referedum result, so this is assessed as valid. However it would be a stronger case if there were also reputable quotes from traders stating that they were pricing in expectations of Brexit happening before the actual vote due to polling which showed Brexit was increasingly likely.
The main event
So far our two conversationalists have traded some valid data points but they have not agreed on a fundamental question:
Did the GBP to EUR exchange rate drop as a result of Brexit or not?
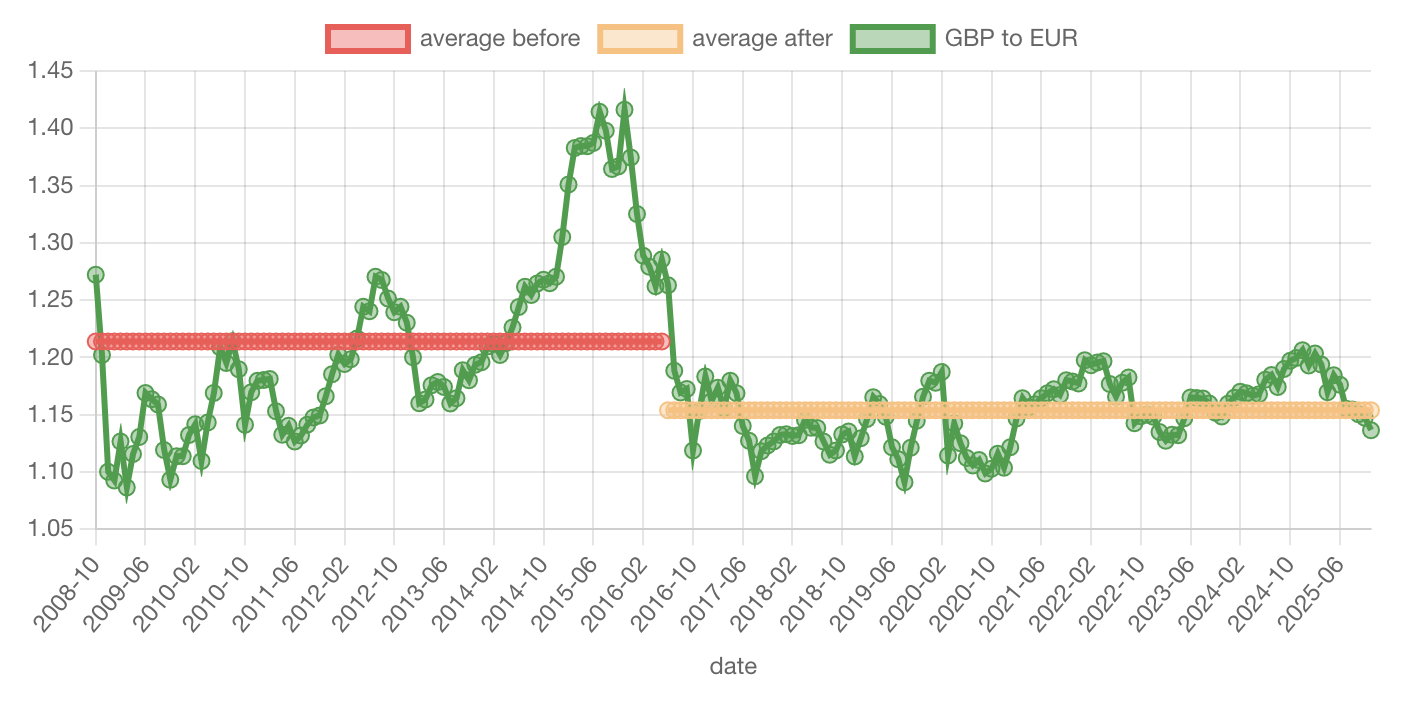
From the WikiSim page and graph it is clear that: yes, GBP to EUR did drop significantly around Brexit and has never recovered. I'm not referring to causation here, just the trend.
So why could they not agree on this point? Let's have a look at the two remaining claims:
FX rate for £stg is down by at least 20% -- average exchange rate from 1 October 2008 to the date of the Brexit referendum was £1 = €1.125 --
I decided to mark PFJ's claim of a drop of "at least 20%" as being "not enough info". If it stood by itself I would have assessed it as correct because obviously there is a drop from the peak of > €1.4 to £1 down to €1.2 or less. However the claim is used in a sentence to support another claim:
meaning all imports are >20% more expensive than they would be without Brexit.
And this is where the problem lies: without Brexit. F Parten is correct to point out that currencies fluctuate. But F Parten themselves then makes a larger and incorrect claim that the average exchange rate from Oct 2008 to the referendum was £1 = €1.125. This is incorrect because the average exchange rate from Oct 2008 to June 2016, according to that WikiSim page, was actually around £1 = €1.21.
Stick to the facts...
It's tricky to attribute the exchange rate drop solely to Brexit because currencies fluctuate for many reasons. However the graph above does clearly show a significant drop around Brexit.
For this reason, and using the analysis in that WikiSim page above, we could now make the claims:
average exchange rate from 1 October 2008 to the date of the Brexit referendum was £1 = €1.214average exchange rate from the Brexit referendum until now is £1 = €1.154
And we could then derive a subsequent claim that:
...but they are hard to calculate
The insight for me is that:
- although exchange rate data is easy to find, it's actually not easy to make sense of in the way our conversationalists were attempting. The mediums of the online graphs from ECB, or any number of other commonly accessible sites, did not allow for a quick calculation to be performed.
Now I'm not naïve in thinking that everyone actually wants to have the accurate facts, but for those that do, the tools we have to hand are not sufficient to allow us to easily validate existing claims in conversations.
Let's take a look at the final claim: government borrowing rates
This comes from PFJ:
government borrowing rates are higher than our European peers --
Unlike with calculating average exchange rate data where the raw data was trivial to access but hard to calculate over, the raw data for government borrowing costs was tricky and took me several hours to find, validate and clean:
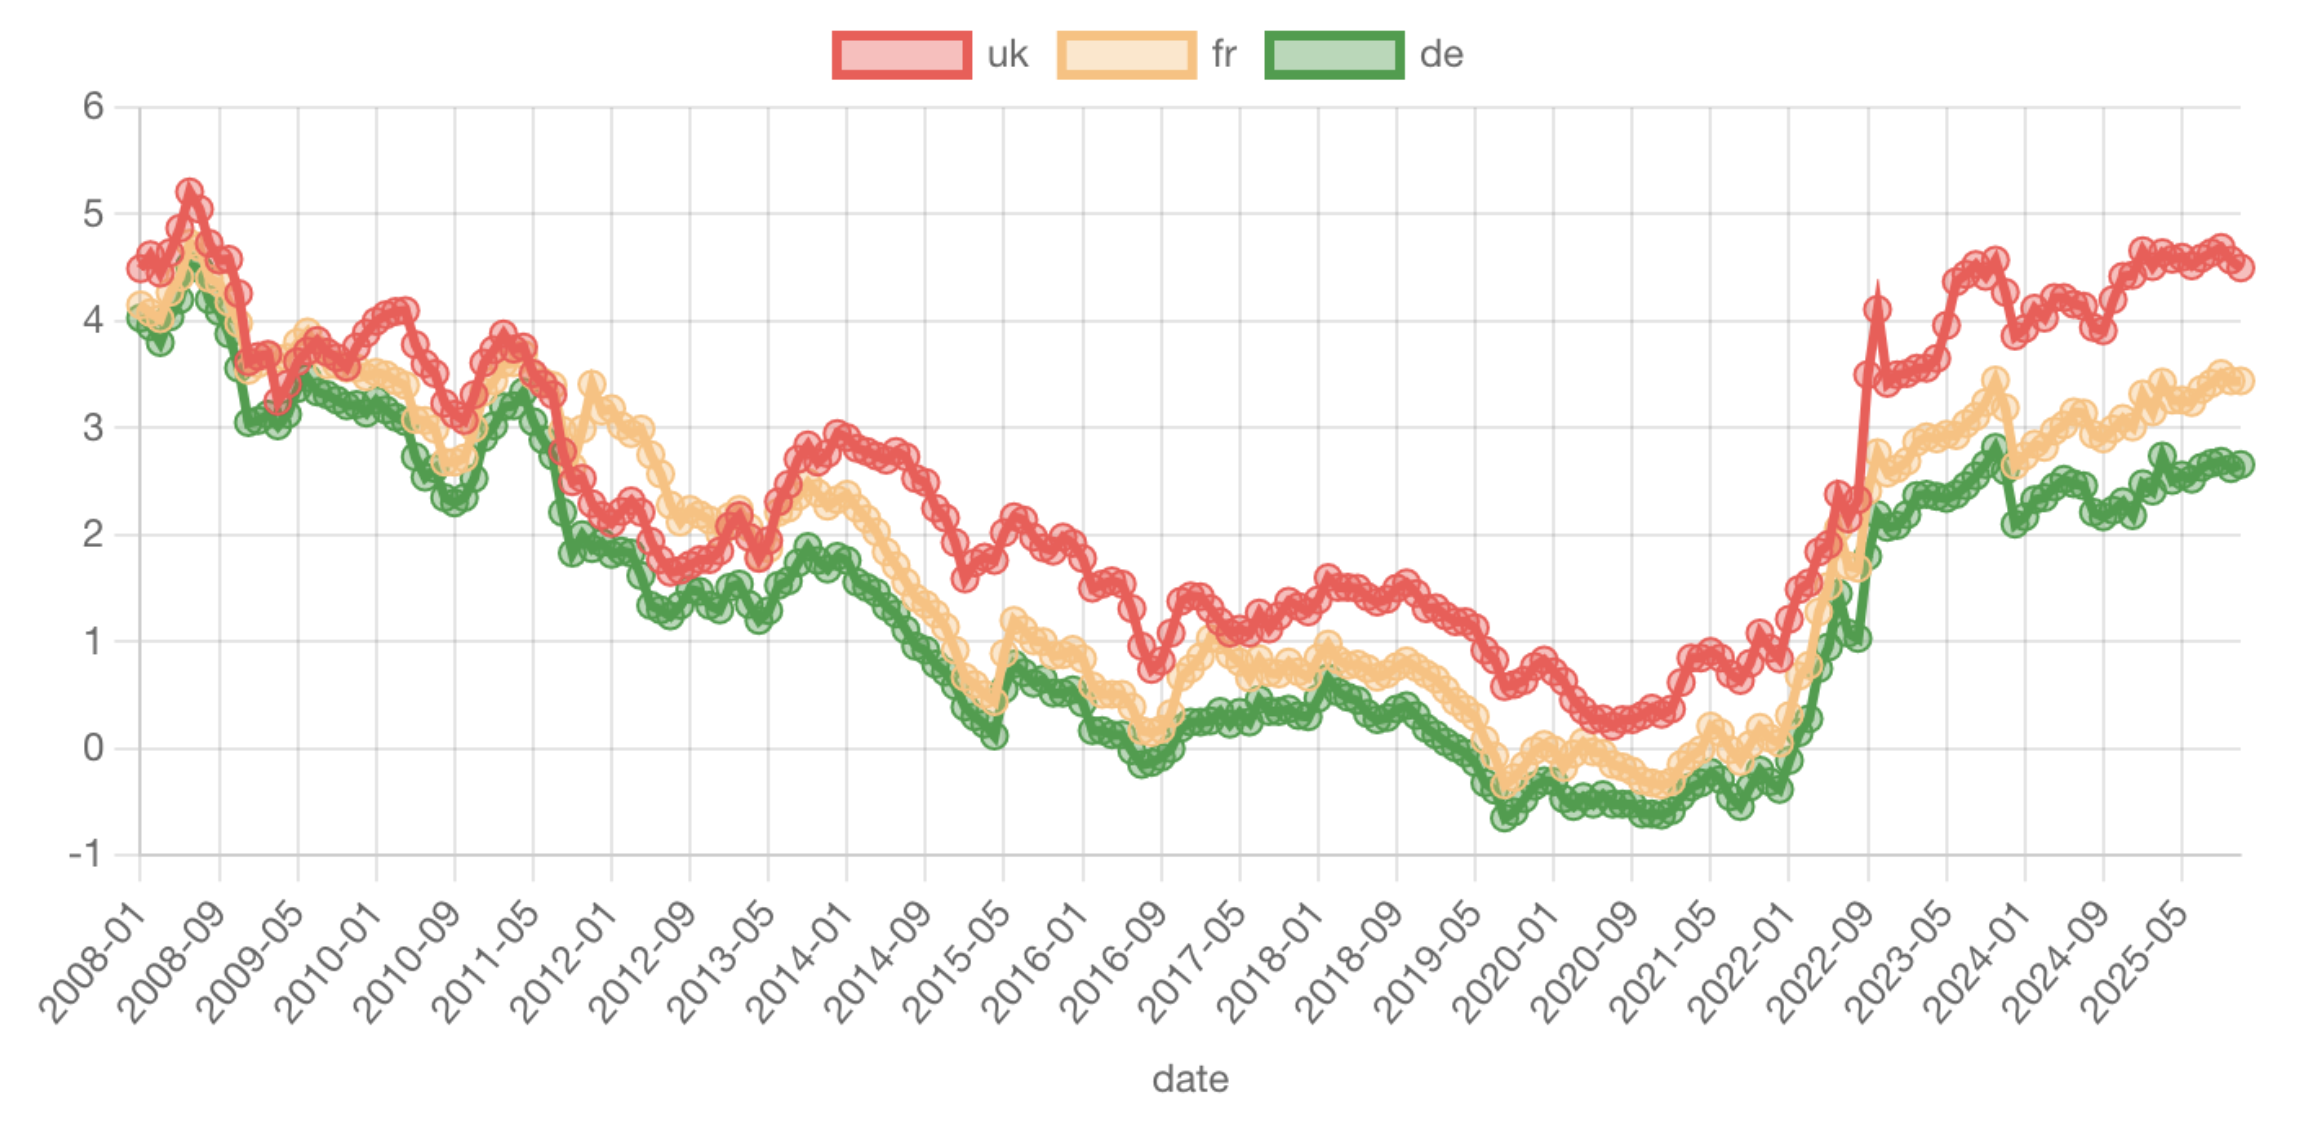
Source: Comparing borrowing costs of UK, France and Germany since 2008
I assessed PFJ's claim as "not enough info" because whilst from this graph it's clear that UK government borrowing costs have generally been higher than France and Germany, this has been true since at least 2008, and the change immediately before and after Brexit seems minimal and perhaps even slightly beneficially as the UK rates drop relatively more than France and Germany immediately after Brexit.
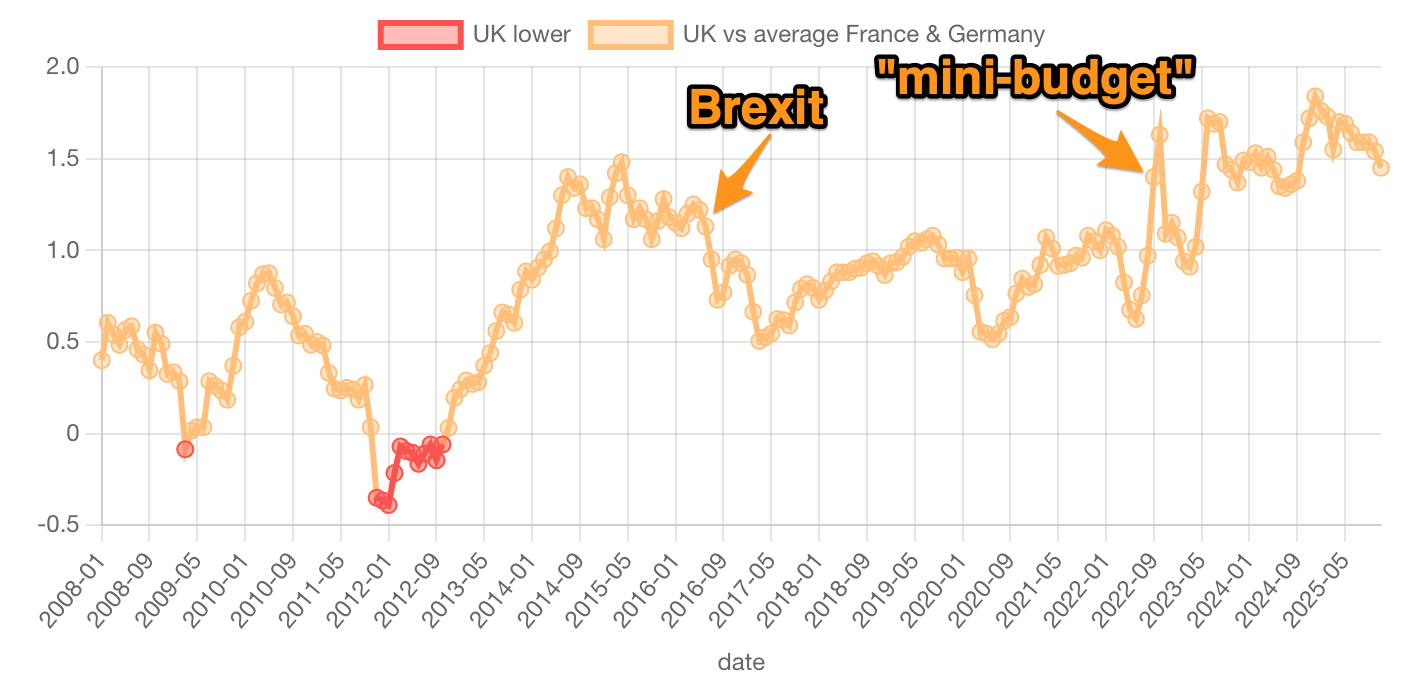
Again if the claim stood by itself I would have assessed it as correct, but as it is within the context of Brexit I think it's not possible to validate or invalidate it. If it's taken just as a standalone sentence referring to "the last lot" i.e. Ms. Truss's "mini-budget" then there does appear to be an increase in the UK's borrowing costs relative to France and Germany around the time of the mini-budget. Again correlation is not causation as this may also be contributed to by Russia's 2022 escalation of its war against Ukraine to a full scale invasion of Ukraine, natural gas and resource prices, Covid pandemic, and other effects.
It's upgrade time!
Ok what might that conversation have looked like if:
- the participants had access to better tools to help them make sense of the data
- and could more thoroughly cite their sources & calculations
Minimal upgrade
The absolutely minimal change would be for someone else to follow up with a comment providing the relevant graphs and calculations to support or refute the claims. Perhaps just citing this blog post.
That's not possible as the FT closes the comments section shortly after an article is published. Is that behaviour of the medium helping or hindering good conversation? In this case its obviously hindering but I do not know what the dynamics of open comment sections are for the FT in particular.
In progress upgrade
I'm going to capitalise on the curiosity that F Parten initially showed when they asked
What dates are you basing your fx rates on?
by having JPF respond with the graphs and calculations they had used to make their claims.
...
In addition the FX rate for £stg is down by at least 20%, meaning all imports are >20% more expensive than they would be without Brexit.
...
What dates are you basing your fx rates on?
£1 ≈ €1.346 from 1 October 2014 to 1 April 2016
£1 ≈ €1.15 from 1 April 2016 to 1 Jan 2020
That's a drop of ~15% in average exchange rate over these two periods:
Just WikiSim any currency exchange rate v £ and there are similar trends.
Yeah ok that was a peak but currencies do fluctuate. We could also choose:
£1 ≈ €1.214 from 1 October 2008 to 1 June 2016
£1 ≈ €1.153 from 1 June 2016 to 1 December 2025
Which is a drop of ~5% not ~15% in average exchange rate. But still a drop so perhaps... <insert some interesting perspective from F Parten and JPF that I don't know and that would have increased our collective wisdom>
Obviously this is fanciful but it's interesting to see how different the conversation might have looked if we had easier access to the data, and preprocessed data, with insights already drawn from it.
How are we expecting people to have good conversations when we don't have the tools, data, and calculations / processing already done for them?
Why don't we have a public commons Wiki for this already? Why don't we have WikiSim.org?... now
that we have WikiSim.org how does it need to be improved to better support us having democratically
relevant conversations?
Unassessed claims
There were other claims in the conversation I did not assess such as:
- £100bln per year in reduced tax revenue
Whilst this is an important, relevant claim, and one with a quantified value, I assume that this is derived from a complex economic model with many assumptions and variables. Therefore I have not attempted to validate or invalidate it here.
The article itself
As an aside the FT article itself makes various claims which have no citations such as:
UK having one of the OECD's highest statutory wage floors
Ambitious young would-be founders are going to America
struggling to convince well-paid [train] crew to do overtime
From looking at this data, the first claim is supported, the UK has a relatively high "minimum wage as a percentage of gross median wage of full-time workers" compared to other OECD countries. Conclusion: validated.
I struggled to verify the second claim. The closest I could get was this article which states that of the 1,078 founders of US unicorn companies: "44% were identified as non-U.S.-born based on their places of birth", and "Indian-born founders form nearly one-fifth of all non-US-born unicorn founders, totalling 90 individuals from India. This is followed by Israel with 52 founders, Canada with 42, the UK with 31, and China with 27". But this isn't a time series so you can't see how this has changed over time, and obviously there would also be a significant lag in founders moving to a country and then reaching unicorn ($1 billion) status. Conclusion: not enough information to validate or invalidate the claim.
This point is better discussed in this previous article from the FT which does say "Some executives [warned that if drivers were] handed backdated lump sums of thousands of pounds [they might feel] less inclined to volunteer for overtime shifts." and also finishes with the quote "You can't rely on overtime forever... it is our job to get the number of drivers up." Note though that both of these claims lack citations and are not easily validated.
It would be very useful for our sense-making and democracy, if more mainstream/legacy news articles (and social media posts) could cite their sources and data for claims they make.
Conclusion
Producing valid claims in conversations is hard without good tools & data. Data is sometimes hard to find, or hard to make sense of as our online tools / mediums do not allow for quick calculations, visualisations and validations to be performed.
We need better tools but we also need to use our existing tools better. We have hyperlinks: let's use them to cite our sources. We have calculation tools: let's use them to construct valid claims and check other claims. We have graphing tools: let's use them to illustrate our points.
I don't mind admitting I have a bias here: I don't care who you vote for, or what you voted for, I just want us all to be slightly better informed. I want to see better conversations, I want to see people using existing tools better, and having better tools to help them make sense of our complex world. I want them to help themselves, others and me.
If we don't provide the necessary tools/mediums, and the access to pre-analysed data, how can we expect meaningful conversations, effective sense-making, or healthy democracies that depend on them?
It's time to upgrade our conversations.
Follow On Conversations
people are just talking imprecisely from how they feel
or people want to validate what they're saying and will reference whatever they can find… but what they reference is rarely correct or if it is then it's not representative i.e. in the example of this conversation upgrade the debaters were referencing individual exchange rate values but these were not representative of the overall trend in exchange rate.
a. (There are also experts but I usually see that even they are only able to hold 100 of the 1000 pieces needed to make sense of the complexity.)
What I'd like to see is a shift in our information ecology to make it easier for a third scenario to emerge: 3. for people who want to validate what they're saying they can now reference something correct and representative
Regarding your point:
parties are willing to accept facts from reputable sources as credibleThis is where the first type of
debater won't care, and I agree that some source of better claims / data / facts won't improve the quality of those conversations. Only if that first type meets with the 3rd type of debater who provides reliable, correct, representative evidence to support a counter claim then although the original type 1 debater will likely remain unmoved the evidence, those claims might help some of the audience to change their minds.
Edited on 2026-01-05 to add an additional graph of UK vs France and Germany government borrowing costs highlighting Brexit and the UK mini-budget.
It's truly terrible but the last lot weren't any better, the real question is what the British public have done to deserve such an inept political class!
This government has now had enough time to demonstrate their commitment to growth and their manifesto ambition, but they deceived everyone, as this article clearly states.
Forget about the last lot, as that's just noise now, and does not excuse what is currently the worst British government in modern times.
This is all now Labours doing.
Brexit (the last lot's project) is costing £100bln per year in reduced tax revenue. That is more than just noise.
In addition the FX rate for £stg is down by at least 20%, meaning all imports are >20% more expensive than they would be without Brexit.
On top of that, government borrowing rates are higher than our European peers due to the last lot.
So, I would say that, while Labour certainly could have been more pro-growth in the budget, having an additional £100b/yr to spend may have helped.
I would hand that accolade to either Liz Truss, Boris Johnson or the architect of the Brexit referendumb, David Cameron.
What dates are you basing your fx rates on?
Pre referendum v Now.
£1 = €1.43 - 16/11/2016
£1 = €1.14 - today
Just Google any currency exchange rate v £ and you'll see a similar trend.
Buy a property abroad? Have holidays abroad?
Be sure to remember who to thank. After you finish queuing in the 'not EU' lane, that is.
The problem with Remainiacs is they so lack critical thinking skills that they assume everyone else does. You could have picked December 30, 2008 when £1 = €1.02 but instead you chose a date which represented almost the absolute high. Currencies fluctuate. The average exchange rate from 1 October 2008 to the date of the Brexit referendum was £1 = €1.125. Your point is nonsense. Financially illiterate people should stick to commentating btl on Guardian.
"remainiacs"?
Look at a graph depicting FX rates against just about any currency, going back 25 years. Now use that wonderous critical thinking to explain the glaringly obvious trend that coincides with the Brexit vote.